Load Testing: Examining the Limitations of a Server
I was wondering how many users the application I deployed on my physical server could handle. Here's how I tested it.
1. Grafana K6
Grafana K6 is a load testing tool that helps you identify server limitations. I chose Grafana K6 as a load tester because I can easily implement a test in JavaScript. With Grafana K6, I will find the bottleneck of my server and increase its throughput.
I needed a server on another private network, so I used AWS EC2 as K6 server
graph LR
    subgraph EC2
        K6[K6 Load Tester]
    end

    K6 --> |"HTTPS (HTTP/1.1)"| Target[Target Server]

    subgraph Physical Computer
        Target
    end
2. Current Status of Target Server (My Server)
2.1. Server Specs
1
2
3
4
5
6
7
8
9
10
11
12
13
ubuntu@server
-------------
OS: Ubuntu 24.04.2 LTS x86_64
Host: ChiefRiver Platform 0.1
Kernel: 6.11.0-25-generic
Uptime: 1 day, 1 hour, 19 mins
Packages: 2240 (dpkg), 13 (snap)
Shell: bash 5.2.21
Resolution: 1366x768
Terminal: node
CPU: Intel i5-3337U (4) @ 2.700GHz
GPU: Intel 3rd Gen Core processor Graphics Controller
Memory: 2267MiB / 7779MiB
2.2. Structure
I’ve used Nginx as a load balancer.
/etc/nginx/nginx.conf
1
2
3
4
5
6
7
8
9
10
11
12
13
14
15
16
17
18
19
20
21
22
23
24
25
26
27
28
29
30
31
32
33
34
35
36
37
38
39
40
41
42
43
user  nginx;
# Use 'auto' to spawn one worker per CPU core for maximum parallelism
worker_processes  auto;

error_log  /var/log/nginx/error.log notice;
pid        /run/nginx.pid;

# Raise per-worker file descriptor limit to 200k to handle high numbers of open connections and files (OS level)
worker_rlimit_nofile 200000;

events {
    use epoll;
    #Allow each worker to handle up to 10,240 simultaneous connections
    worker_connections  10240;
    # Enable accepting multiple new connections at once to improve throughput under load
    multi_accept on;
}

http {
    include       /etc/nginx/mime.types;
    default_type  application/octet-stream;

    client_max_body_size 100G;

    log_format  main  '$remote_addr - $remote_user [$time_local] "$request" '
                      '$status $body_bytes_sent "$http_referer" '
                      '"$http_user_agent" "$http_x_forwarded_for"';

    access_log  /var/log/nginx/access.log  main;

    sendfile        on;
    tcp_nopush     on;
    keepalive_timeout  65;

    gzip  on;
    gzip_vary on;
    gzip_proxied any;
    gzip_comp_level 6;
    gzip_types text/plain text/css text/xml application/json application/javascript application/xml+rss application/atom+xml image/svg+xml;

    include /etc/nginx/sites-enabled/*;
}
/etc/nginx/site-enabled/server.conf
1
2
3
4
5
6
7
8
9
10
11
12
13
14
15
16
17
18
19
20
21
22
23
24
25
26
27
28
29
30
31
32
33
upstream project-is-it-down-api {
  server 127.0.0.1:1025;
  keepalive 128;
}

server {
  server_name api.kaist.techceo.kr;
  location / {
        proxy_pass http://project-is-it-down-api;
        proxy_http_version 1.1;
        proxy_set_header Upgrade $http_upgrade;
        proxy_set_header Connection 'upgrade';
        proxy_set_header Host $host;
        proxy_cache_bypass $http_upgrade;
    }

    listen 443 ssl; # managed by Certbot
    ssl_certificate /etc/letsencrypt/live/api.kaist.techceo.kr/fullchain.pem; # managed by Certbot
    ssl_certificate_key /etc/letsencrypt/live/api.kaist.techceo.kr/privkey.pem; # managed by Certbot
    include /etc/letsencrypt/options-ssl-nginx.conf; # managed by Certbot
    ssl_dhparam /etc/letsencrypt/ssl-dhparams.pem; # managed by Certbot
}

server {
    if ($host = api.kaist.techceo.kr) {
        return 301 https://$host$request_uri;
    } # managed by Certbot


    server_name api.kaist.techceo.kr;
    listen 80;
    return 404; # managed by Certbot
}
Currently, only one container exists.
graph LR
    Browser --> |"HTTPS (HTTP/2.0)"| Frontend[Vercel<br/>Frontend Server]
    Browser --> |"HTTPS (HTTP/1.1)"| Nginx[Nginx Server]
    K6[K6 Load Tester] --> |"HTTPS (HTTP/1.1)"| Nginx

    subgraph Target[Target Server<br/>Physical Computer]
        Nginx --> |"HTTP (HTTP/1.1)"| Backend[Backend<br/>Docker Container]
    end
3. Grafana K6 Server
3.1. Server Specs (AWS t3a.small)
1
2
3
4
5
6
7
8
9
10
11
12
13
ubuntu@ip-172-31-35-93
----------------------
OS: Ubuntu 24.04.2 LTS x86_64
Host: t3a.small
Kernel: 6.8.0-1024-aws
Uptime: 2 hours, 23 mins
Packages: 763 (dpkg), 4 (snap)
Shell: bash 5.2.21
Resolution: 800x600
Terminal: /dev/pts/0
CPU: AMD EPYC 7571 (2) @ 2.199GHz
GPU: 00:03.0 Amazon.com, Inc. Device 1111
Memory: 216MiB / 1916MiB
3.2. Test Code
1
K6_WEB_DASHBOARD=true k6 run script.js
1
2
3
4
5
6
7
8
9
10
11
12
13
14
15
16
17
18
19
20
21
22
import http from 'k6/http';
import { sleep } from 'k6';

export const options = {
  stages: [
    // Ramp up to 1000 virtual users over 10 minutes
    { duration: '10m', target: 1000 }
    //{ duration: '10m', target: 2000 }
  ],
};

export default function (){
  http.get('https://api.kaist.techceo.kr/api/server-status',{
    headers:{
      'Origin':'https://kaist.vercel.app'
    },
    timeout: '10000s'
  });

  // Simulate real user behavior by adding a delay between requests
  sleep(1);
}
You need to open port 5665 on EC2 and Security Group to access the web dashboard
4. Test Results
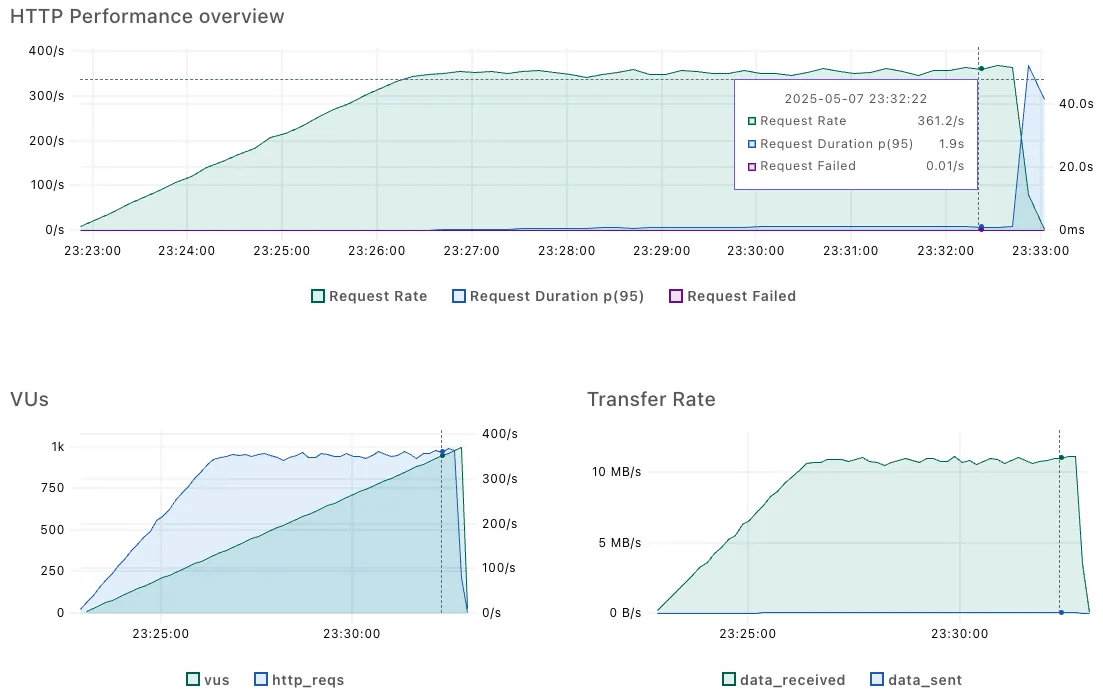
- Throughput: peaking at ~350 RPS
- Latency: average ~1.5 seconds, 95th percentile ~1.2 seconds, 99th percentile ~1 minute
5. What is the bottleneck of the server?
5.1. Network?
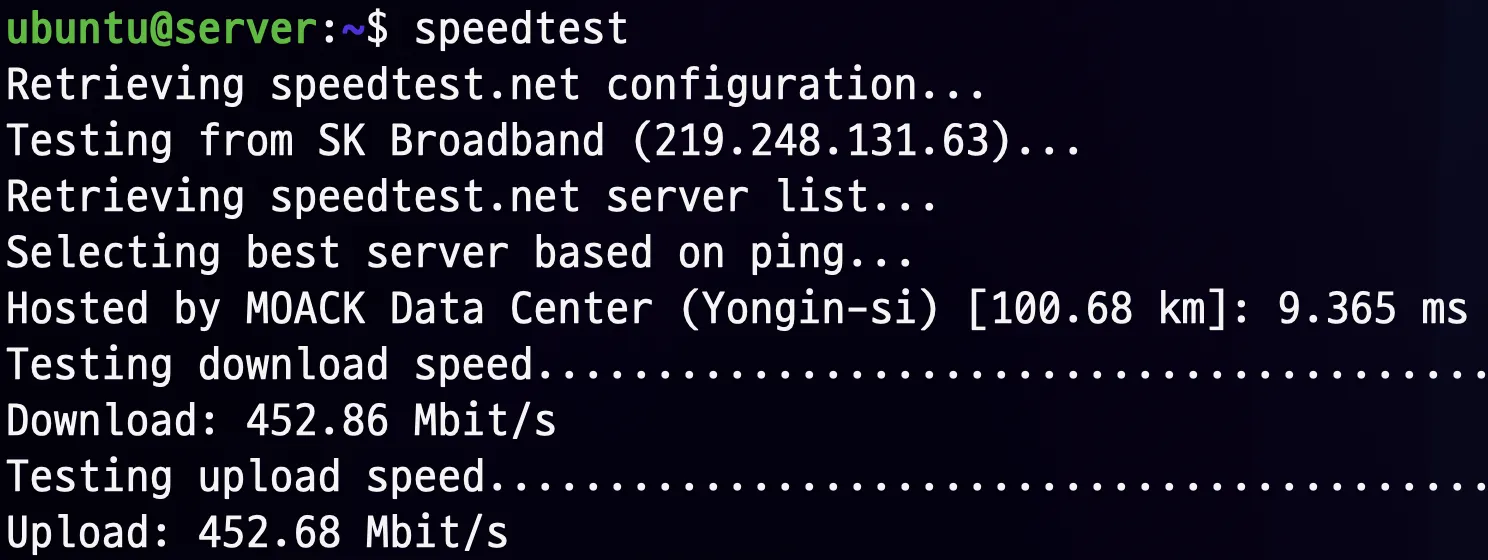 Network Speed
- The maximum network speed is sufficient to handle 66 Mbps at peak times.
5.2. Database?
1
2
3
4
5
6
7
let start = Date.now();
// ...get documents with mongodb and save to in-memory cache
duration[0] = Date.now() - start;
start = Date.now();
// ...get documents with mongodb and save to in-memory cache
duration[1] = Date.now() - start;
logger.info(`Data fetch duration: ${duration[0]}ms, ${duration[1]}ms`);
 DB Latency
Database fetching is not the bottleneck.
- It only takes 20 to 40 ms.
- I implemented this as a cron job.
- The total size of the documents in the collection is always the same (220MB).
5.3. Nginx?
1
2
3
4
5
6
7
8
9
10
11
http {
  log_format  main_timing  '$remote_addr - $remote_user [$time_local] "$request" '
                          '$status $body_bytes_sent "$http_referer" '
                          '"$http_user_agent" "$http_x_forwarded_for" '
                          'rt=$request_time '
                          'urt=$upstream_response_time '
                          'uct=$upstream_connect_time '
                          'uht=$upstream_header_time '
                          'ua=$upstream_addr';
  ...
The difference between rt and urt represents the Nginx overhead, and urt represents the application overhead.
 Nginx Latency
There is no nginx overhead.
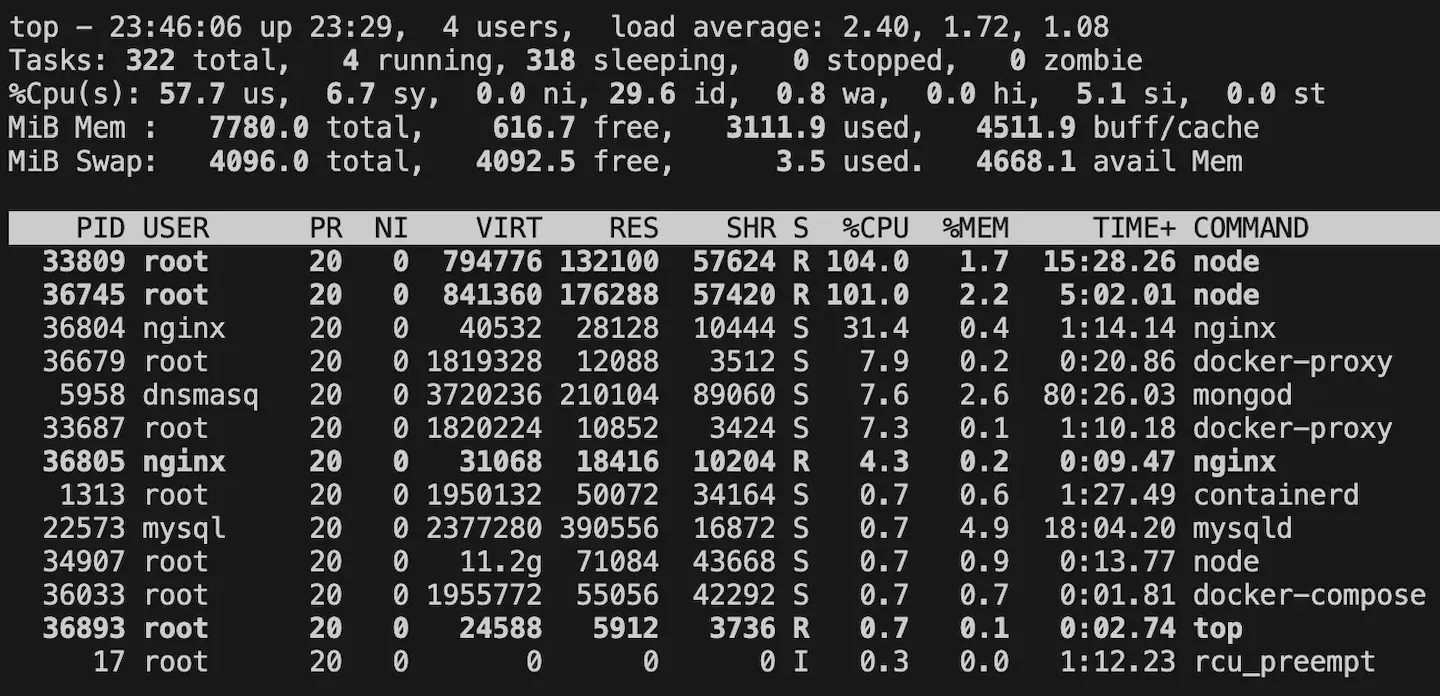
5.4. Application?
1
top
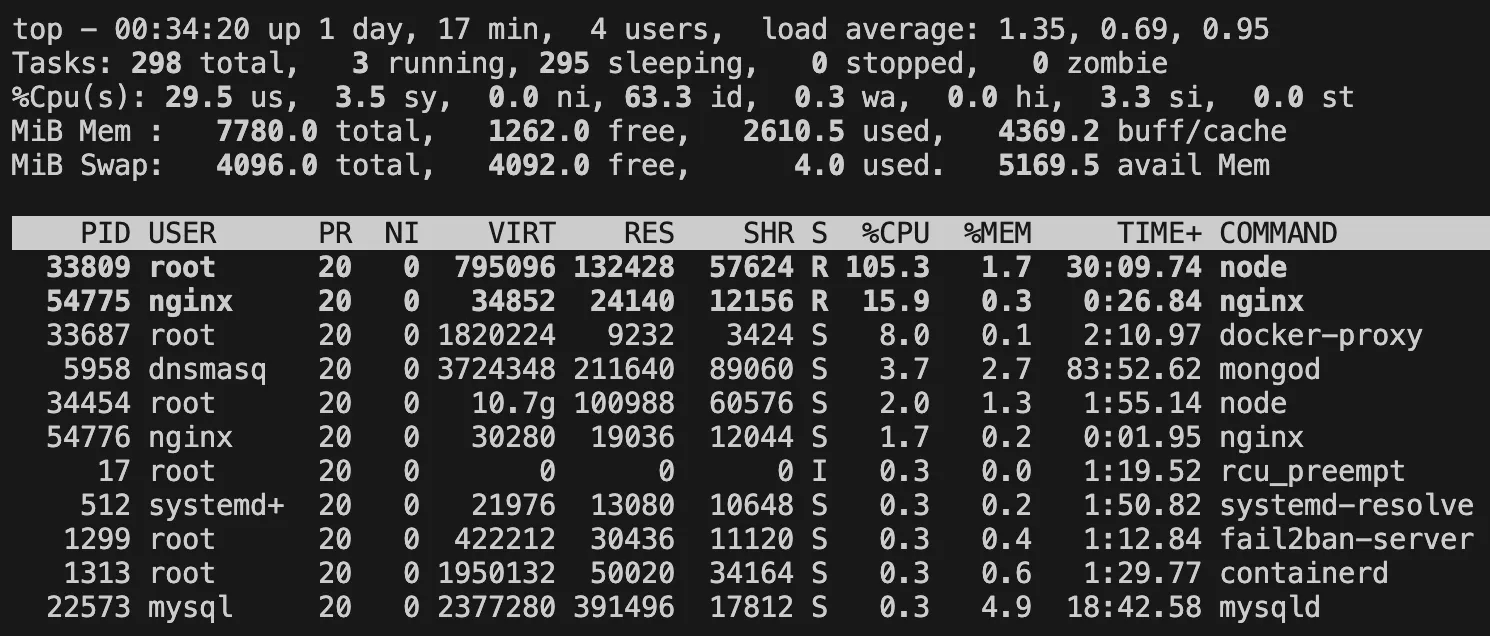
A Node.js process is the cause of the bottleneck! The Node.js process is using 100% of a single CPU core, but it cannot utilize more than that. This is because Node.js is single-threaded. In other words, a single Express.js application can only use one CPU core.
6. How I changed it to improve
6.1. Increasing the number of backend containers
I am applying round-robin.
6.1.1. Improvements
graph LR
    Browser --> |"HTTPS (HTTP/2.0)"| Frontend[Vercel<br/>Frontend Server]
    Browser --> |"HTTPS (HTTP/1.1)"| Nginx[Nginx Server]
    K6[K6 Load Tester] --> |"HTTPS (HTTP/1.1)"| Nginx

    subgraph Target[Target Server<br/>Physical Computer]
        Nginx --> |HTTP/1.1| Backend1[Backend<br/>Docker Container]
        Nginx --> |HTTP/1.1| Backend2[Backend<br/>Docker Container]
        Nginx --> |HTTP/1.1| Backend3[Backend<br/>Docker Container]
    end
6.1.2. Results
Test results when there are two backend containers
Test results when there are three backend containers
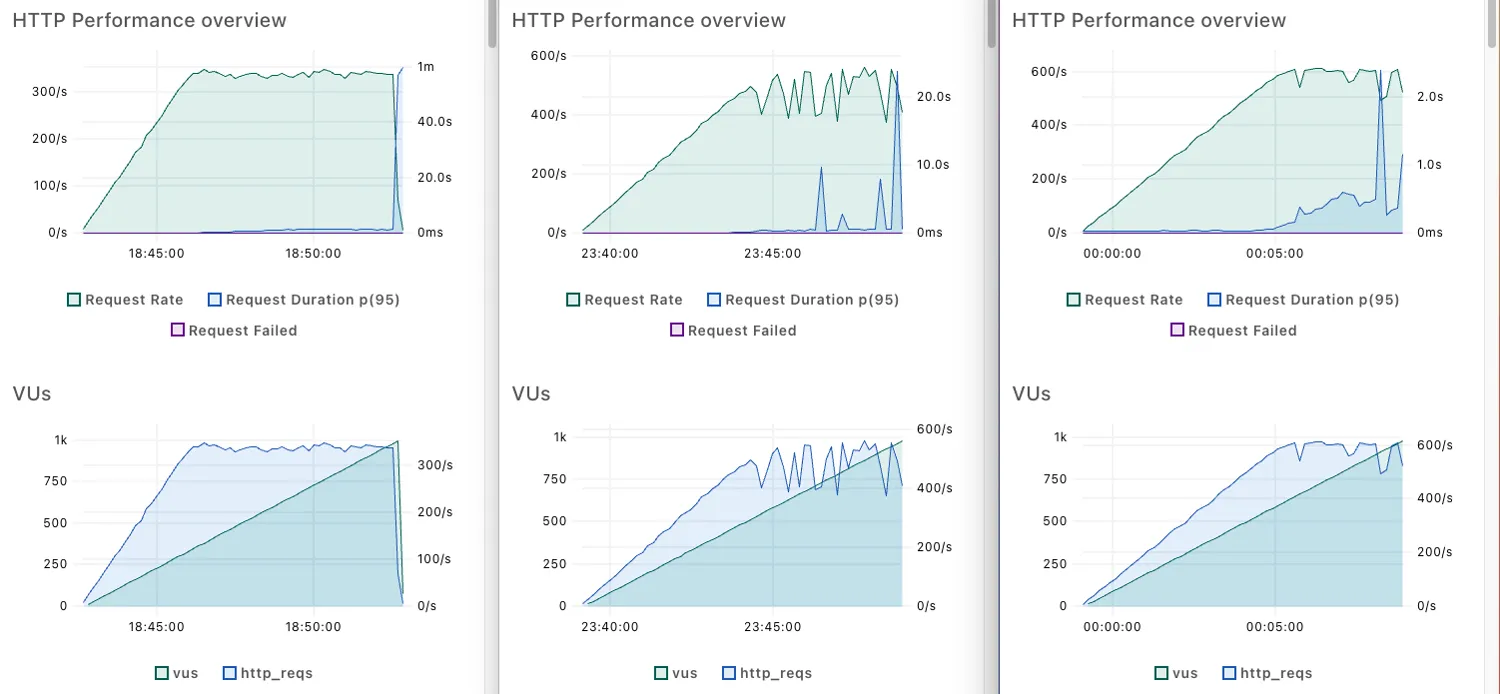 Lef: one backend containers set up
Mid: two backend containers set up
Rig: three backend containers set up
The throughput showed a linear relationship with the increasing number of containers, but it did not increase exactly two or three times.
1
top
 CPU status monitoring when there are two backend containers
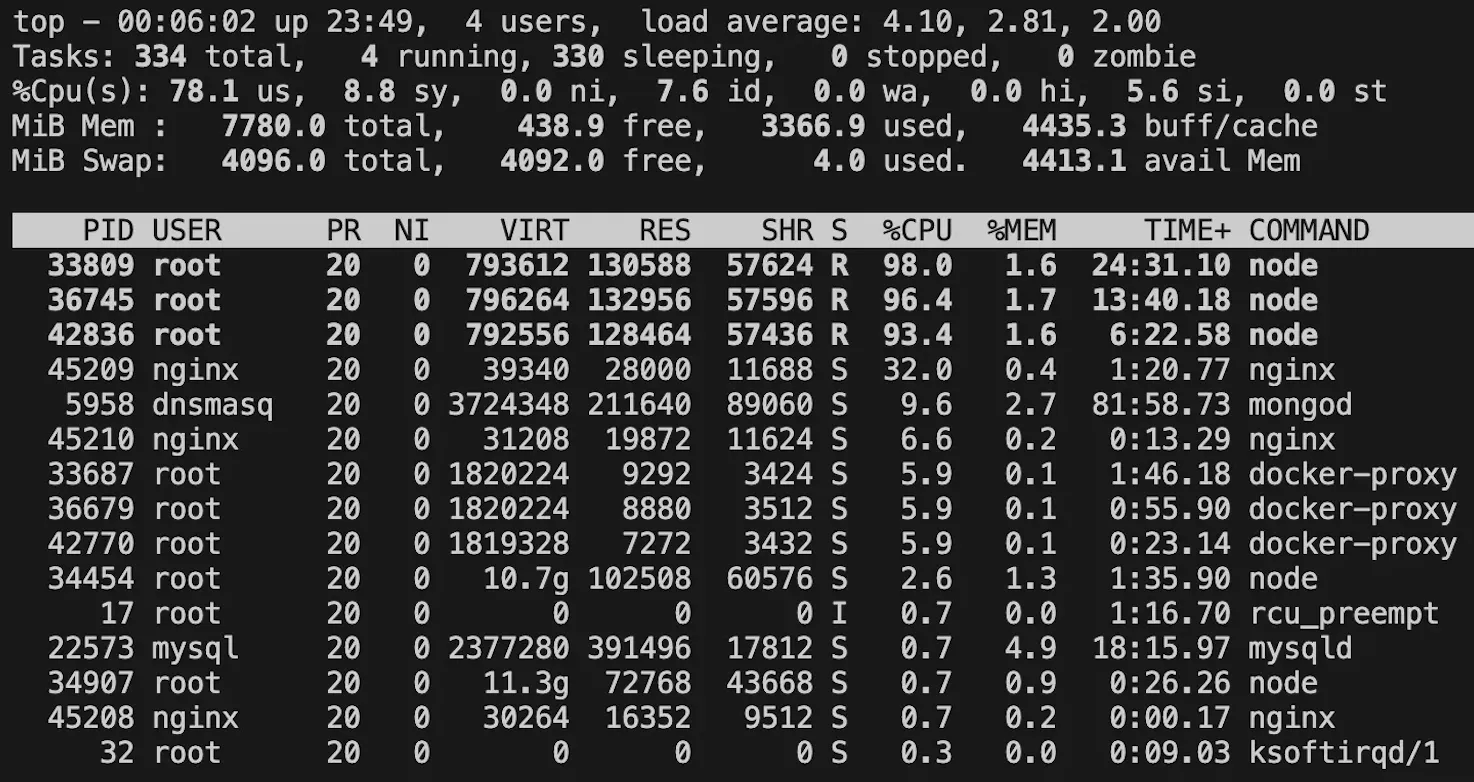 CPU status monitoring when there are three backend containers
I also confirmed that each container uses 100% of each core.
6.2. Decreasing CPU-heavy operations in application level
6.2.1. Improvements
CPU-intensive operations include functions such as JSON.stringify(obj), JSON.parse(str), structuredClone(obj), lodash.cloneDeep(obj), array.sort(), and array.map(). In my Express.js backend code, I simply pre-processed the result of JSON.stringify(obj).
1
2
3
4
5
6
7
8
9
10
11
//let cachedData: AllServerStatus = {};
let cachedDataStr: string;

/// cronJob to fetch database data.
...
///

app.get("/api/server-status", async (req: Request, res: Response) => {
  //res.status(200).json(cachedData);
  res.status(200).send(cachedDataStr);
});
6.2.2. Results
Test results when Cpu-Heavy Operation is optimized
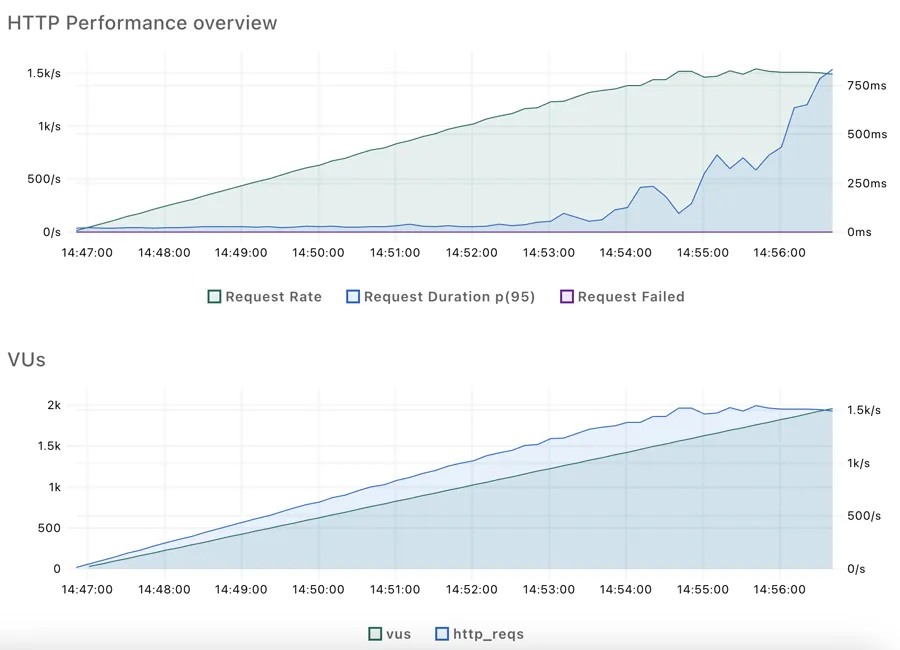 CPU status monitoring when CPU-heavy operations are optimized
The performance has improved dramatically. The server can now handle 1,500 requests per second.
1
glances
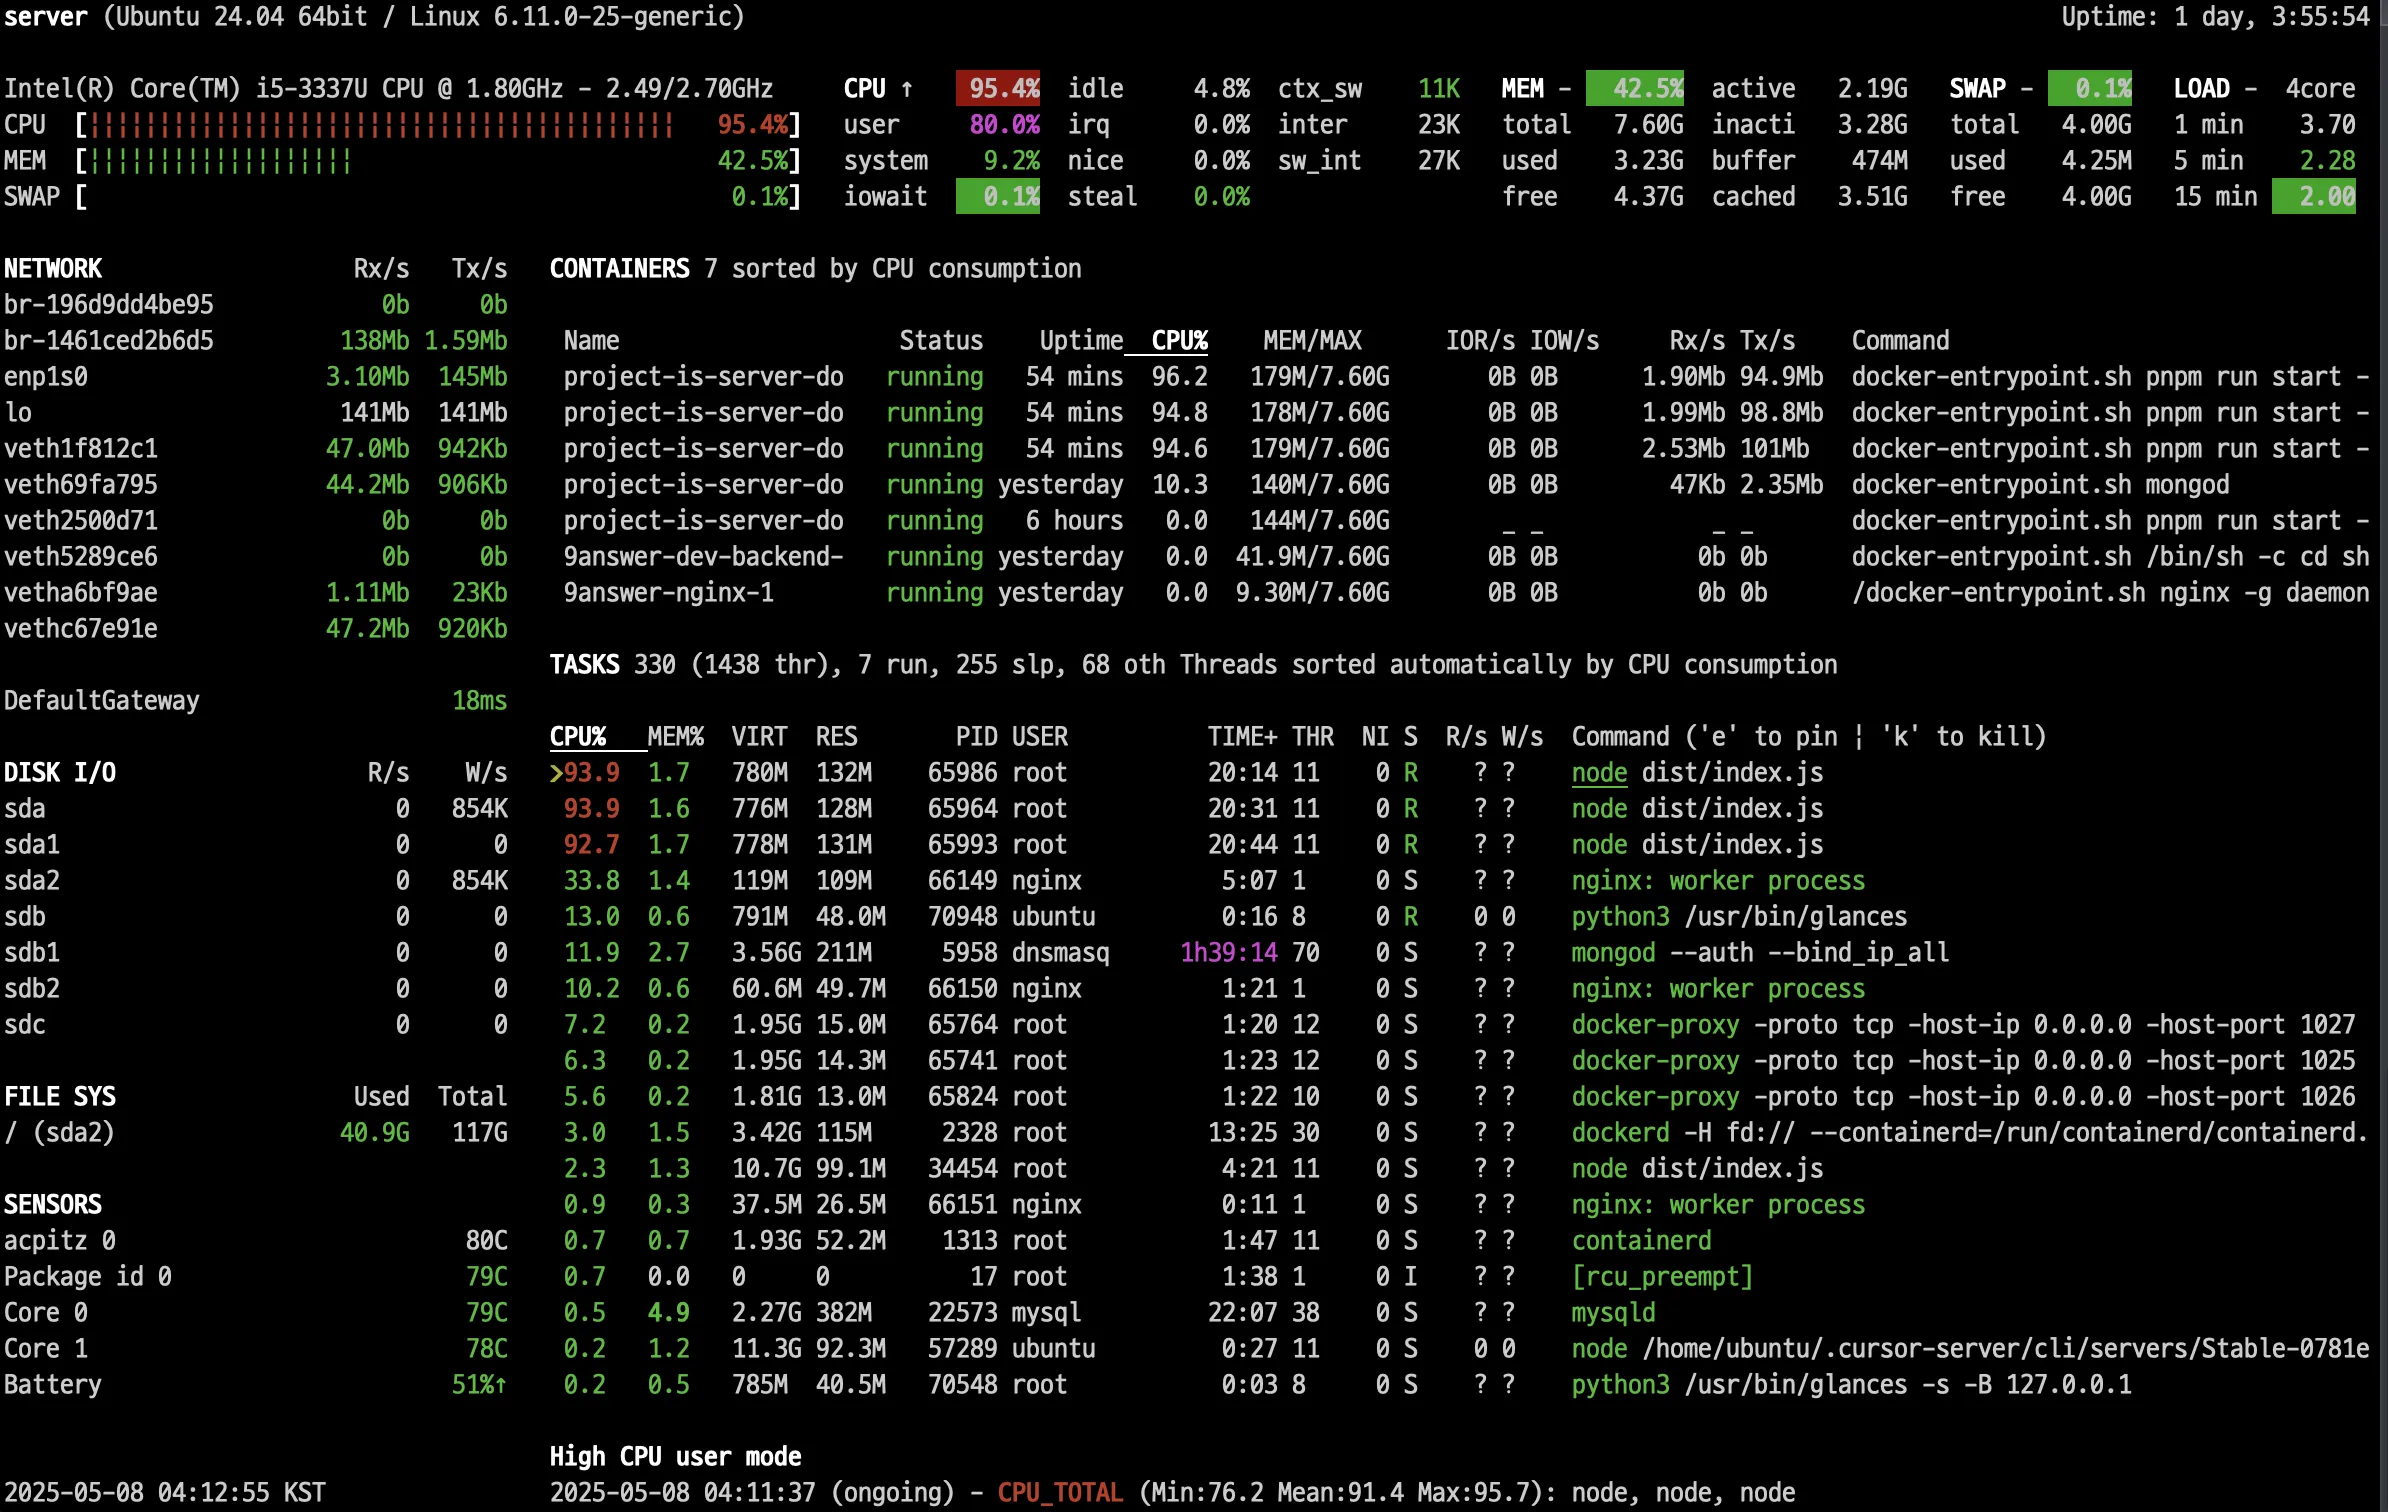 Burning my computer…
The glances command gives more specific status information about the server than the top command, but it uses more resources.
6.3. Changing from HTTP/1.1 to HTTP/2.0 can improve performance?
6.3.1. Improvements
1
2
3
4
5
6
7
8
9
10
11
12
13
14
server {
  server_name api.kaist.techceo.kr;
  location / {
        proxy_pass http://project-is-server-down-api;
        proxy_http_version 1.1;
        proxy_set_header Upgrade $http_upgrade;
        proxy_set_header Connection 'upgrade';
        proxy_set_header Host $host;
        proxy_cache_bypass $http_upgrade;
    }

    #listen 443 ssl;
    listen 443 ssl http2;
...
graph LR
    Browser -->|"HTTPS (HTTP/2)"| Frontend[Vercel<br/>Frontend Server]
    Browser -->|"HTTPS (HTTP/2)"| Nginx[Nginx Server]
    K6[K6 Load Tester] -->|"HTTPS (HTTP/2)"| Nginx

    subgraph Target[Target Server<br/>Physical Computer]
        Nginx -->|HTTP/1.1| Backend1[Backend<br/>Docker Container]
        Nginx -->|HTTP/1.1| Backend2[Backend<br/>Docker Container]
        Nginx -->|HTTP/1.1| Backend3[Backend<br/>Docker Container]
    end
6.3.2. Results
Test results when http2 set up
There is no performance difference between http/1.1 and http/2.0.
7. Conclusion
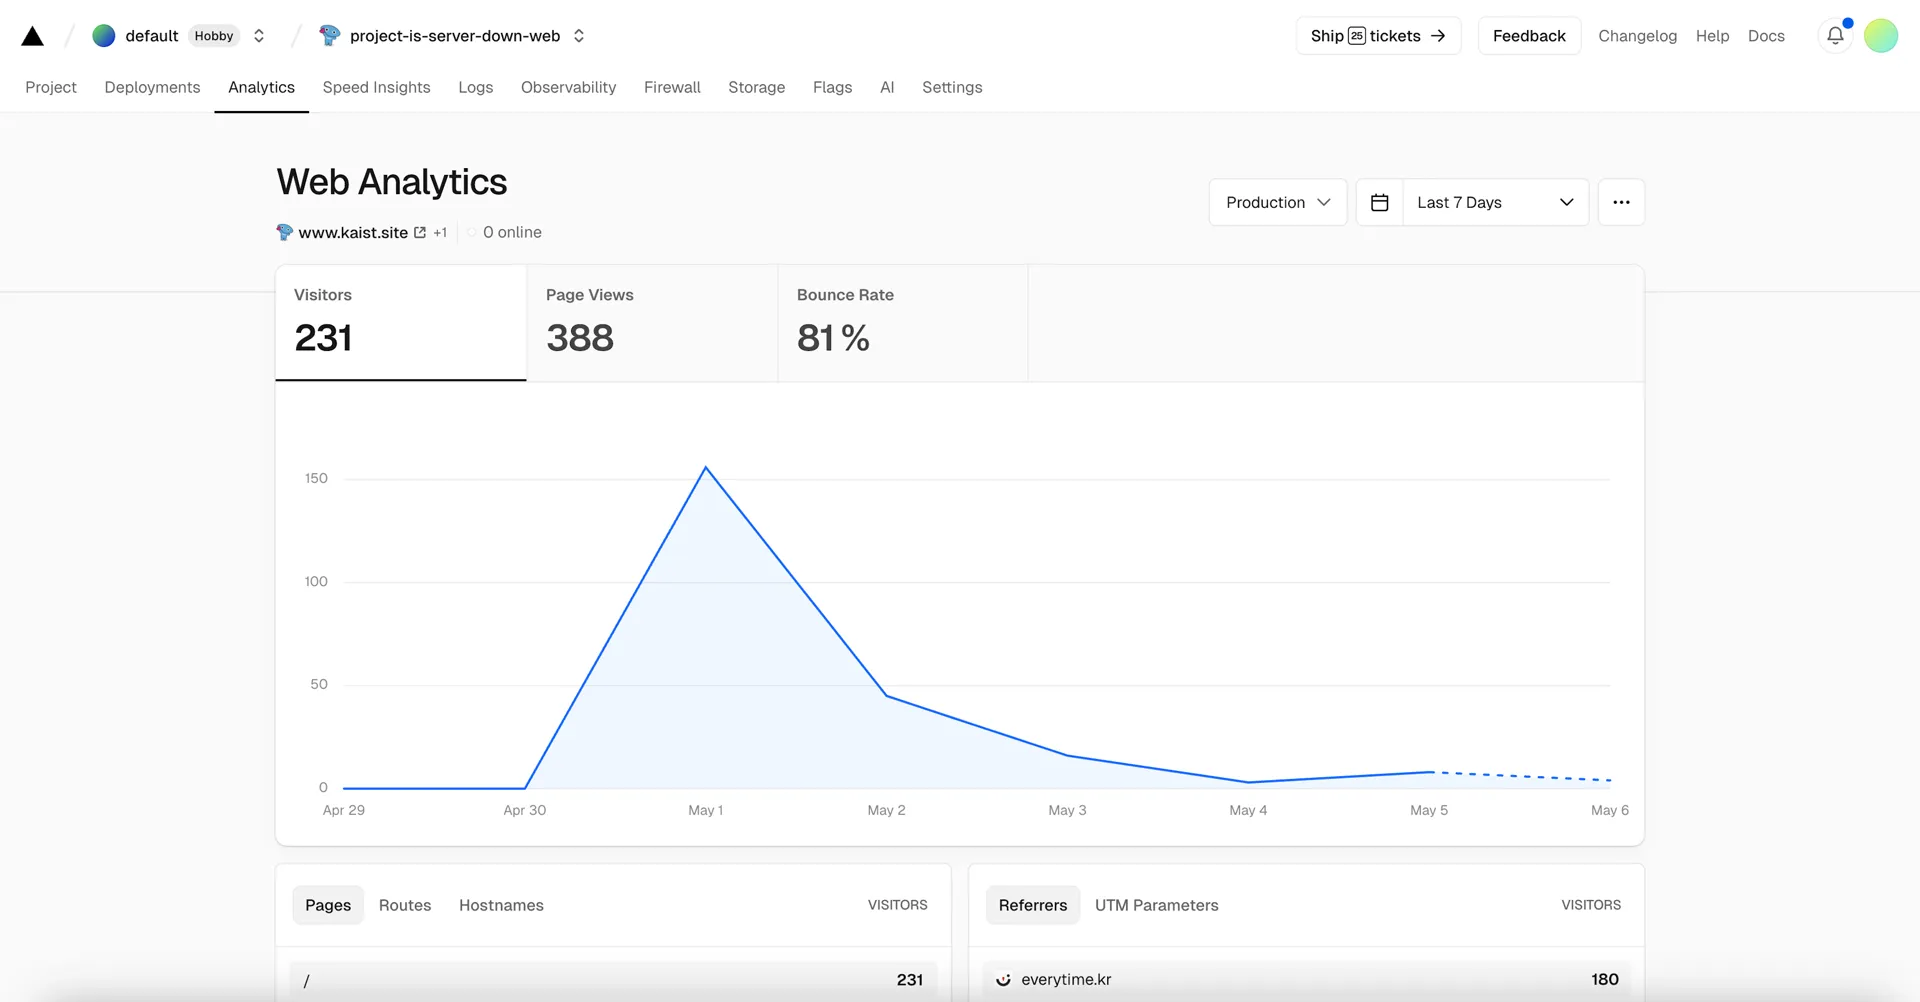 Vecel Web Analytics: Real Visitors
It’s user traffic that doesn’t require load testing, but it was nice to take this opportunity to study load testing.